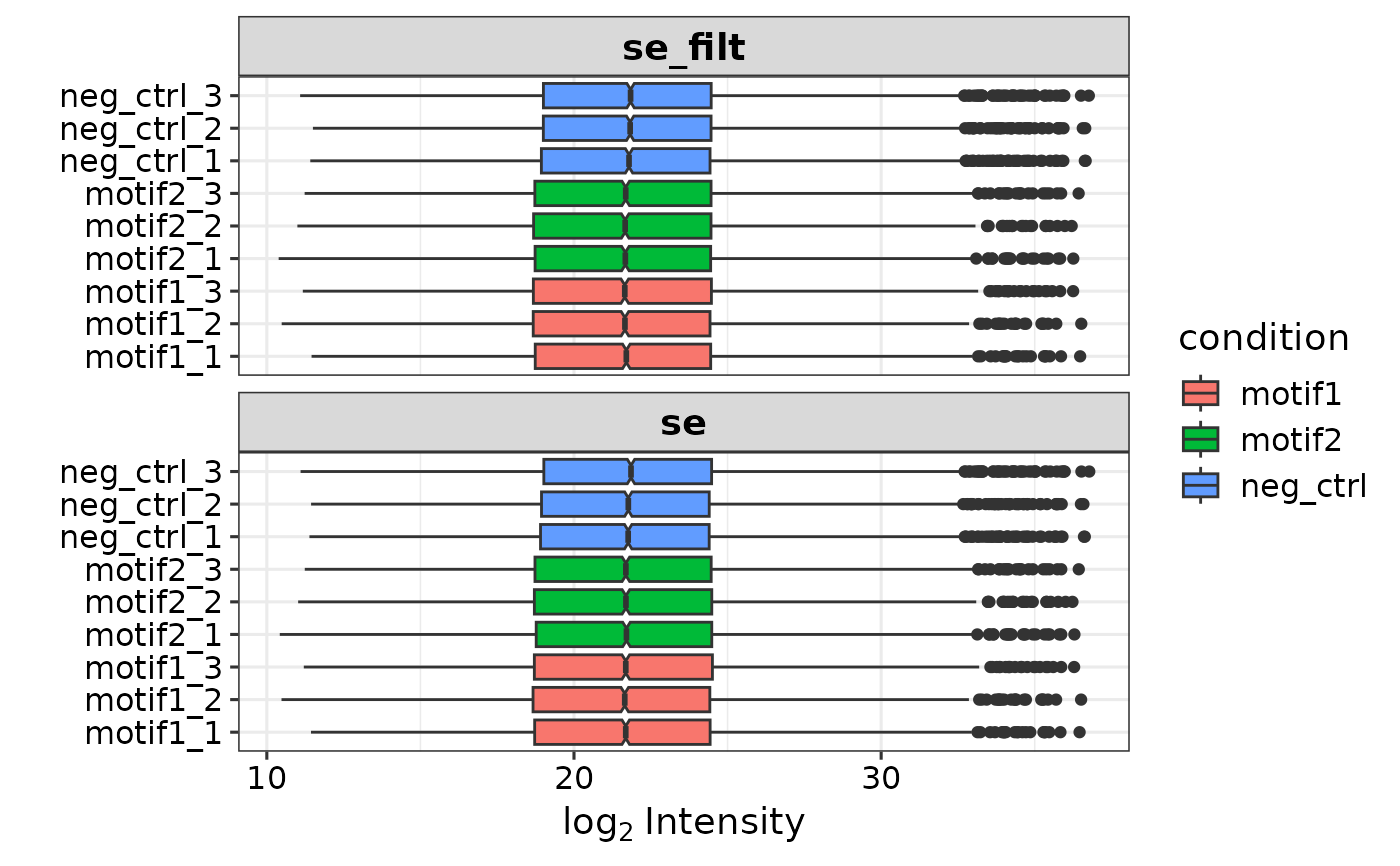
Prepare data for plot_DEP_barplot function.
Arguments
- res
A data frame with results from get_DEPresults()
- comparisons
A character vector specifying which comparisons to include. The default 'all' considers all comparisons present in res. The bars are plotted in the order of specified comparisons.
- names
(optional). Specifies the labels for the different bars. Defaults to the comparison names in colnames(res)
Examples
se <- prepare_se(report.pg_matrix, expDesign)

#> Imputing along margin 2 (samples/columns).
#> [1] 0.3066195
#> Imputing along margin 1 (features/rows).
#> Warning: 36 rows with more than 50 % entries missing;
#>  mean imputation used for these rows
#> Cluster size 5574 broken into 3662 1912
#> Cluster size 3662 broken into 1462 2200
#> Done cluster 1462
#> Cluster size 2200 broken into 1110 1090
#> Done cluster 1110
#> Done cluster 1090
#> Done cluster 2200
#> Done cluster 3662
#> Cluster size 1912 broken into 1379 533
#> Done cluster 1379
#> Done cluster 533
#> Done cluster 1912
res <- get_DEPresults(se, type  = 'all')
#> Tested contrasts: neg_ctrl_vs_motif1, neg_ctrl_vs_motif2, motif1_vs_motif2
data <- prepare_barplot_data(res) # All conditions
data <- prepare_barplot_data(res, comparisons = c('neg_ctrl_vs_motif1',
                                                  'neg_ctrl_vs_motif2')) #
# Only two comparisons included.